
The charting engine behind Scruffy Markets
See the market.
Then see it differently.
Scruffy Charts is a modern, browser-based charting platform built to make market analysis flexible, intuitive and deeply connected to deliberate trading practice.
Explore the workspace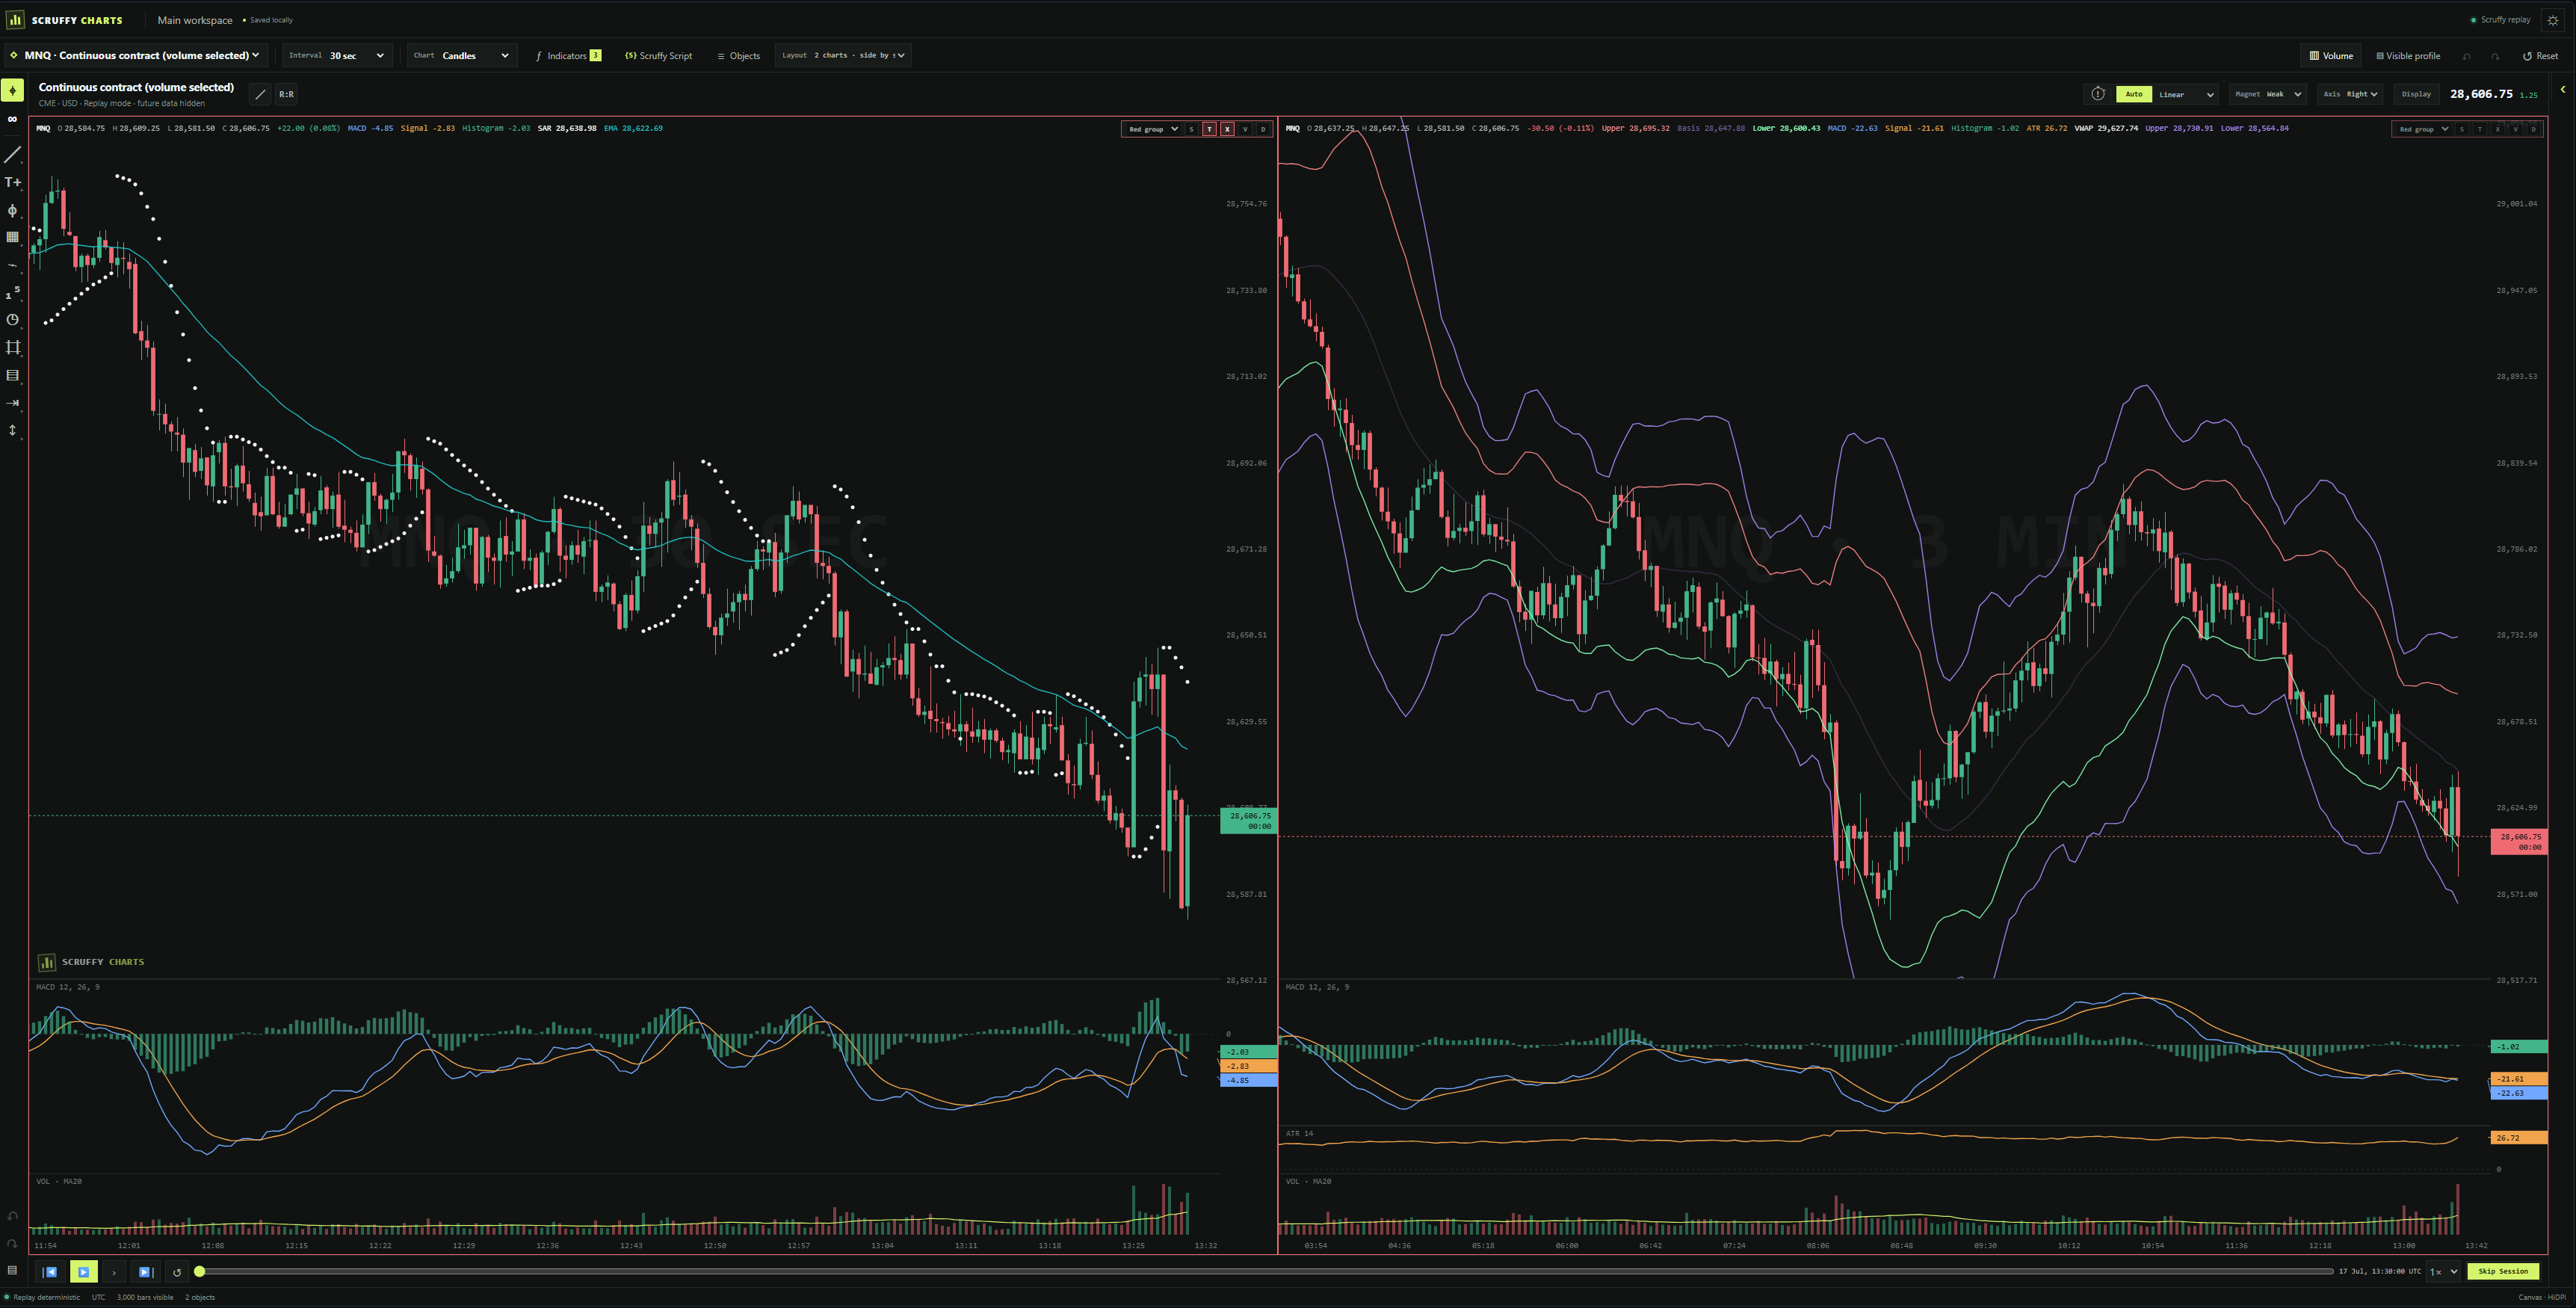
Developed as the charting engine behind Scruffy Markets, the platform combines professional analytical tools with detailed historical replay. It gives traders a focused environment in which to study price action, test ideas and improve decision-making.
Multiple chart layouts, instruments and timeframes let you view the market from several perspectives at once. Alongside traditional candlesticks, traders can use alternative chart types, technical indicators, drawing tools and volume-profile analysis. Saved workspaces, themes, time zones and visual presets make the desk feel distinctly yours.
Your analysis library
Build the view you actually trade.
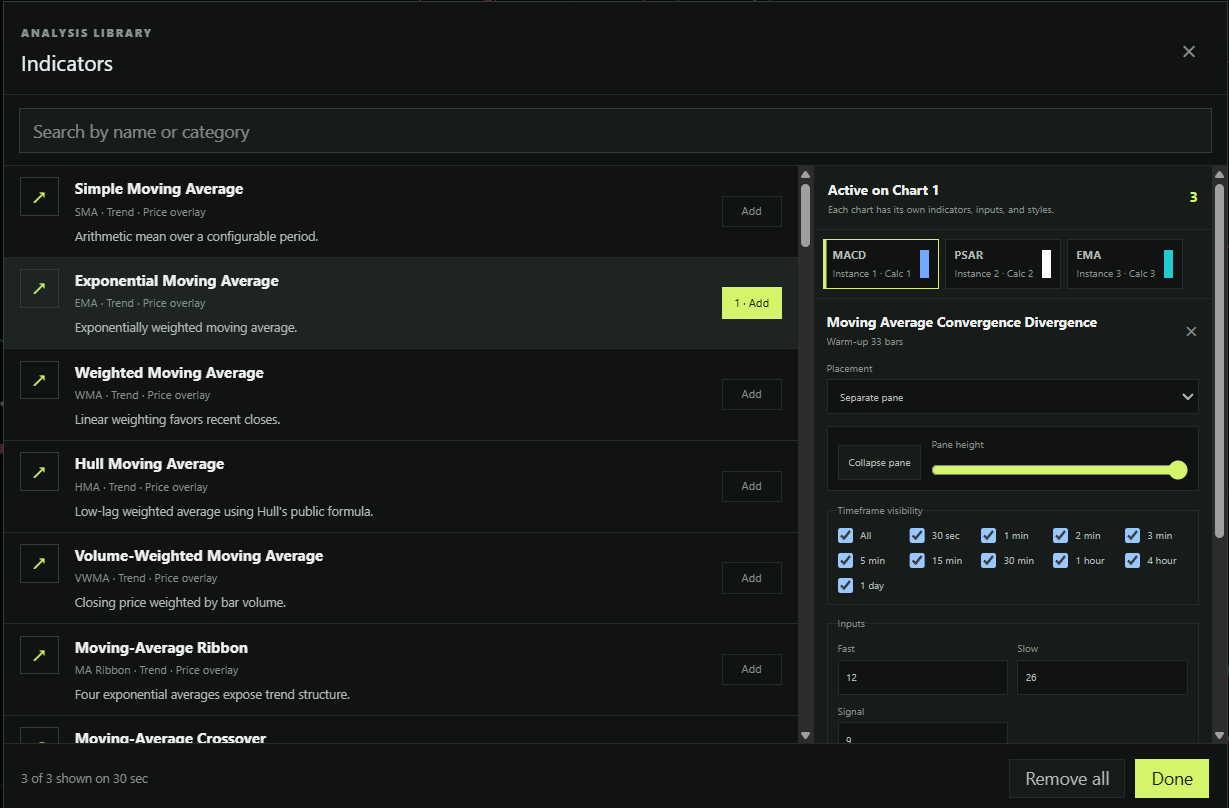
Choose from a growing library of studies, then tune placement, timeframe visibility, inputs and styling chart by chart. Indicators remain useful tools—not permanent furniture.
- Independent settings on every chart
- Overlay or separate-pane placement
- Clear, searchable indicator library
Replay with intent
Hide what happens next.
Historical data can be played at variable speeds, paused, advanced tick by tick or bar by bar, and navigated to specific moments. You can examine developing market structure without the gift of hindsight—creating a more realistic setting for practice, strategy development and review.
Scruffy Script
Your ideas belong on the chart.
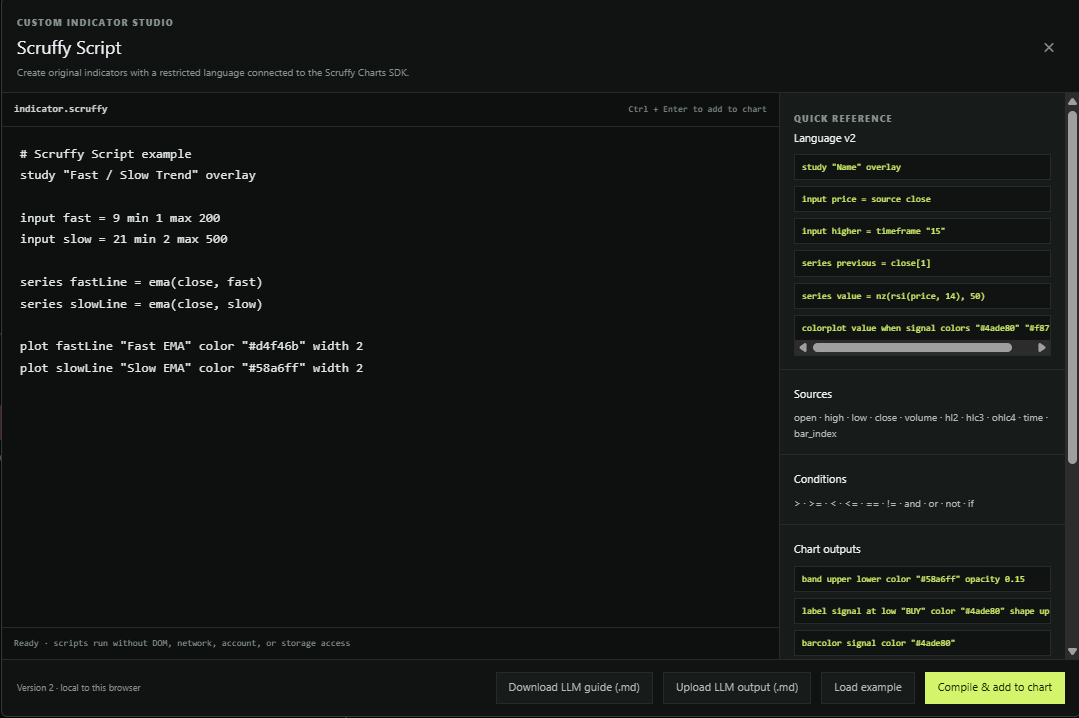
Scruffy Script is a purpose-built language for defining custom studies, calculated series, plots and bands. It extends the built-in indicators and turns your own analytical ideas into reusable chart tools.
series fastLine = ema(close, fast)Simple enough to read. Powerful enough to build with.Built by traders, for traders
Put Scruffy Charts
through its paces.
Open a replay session and experience the charting engine inside Scruffy Markets.